
Senticor · Open source · Pre-alpha
Vaktaro: service checks and OpenTelemetry integration
An open-source Senticor project connecting independently operated service checks to existing monitoring, with explicit result semantics and a tested path from measurement to dashboard.
Situation: another probe must justify its place
A service can be reachable from one network and unavailable from another. Collecting more measurements helps only if operators can interpret them, associate them with a location and decide whether a missing result means service failure or missing evidence.
- Grafana Cloud Synthetic Monitoring already provides public and private probes with results in its managed platform.
- Uptime Kuma offers self-hosted availability checks, notifications and status pages.
- Prometheus with the blackbox exporter adds service probes to an operator-managed monitoring environment.
Vaktaro explores independently operated nodes, results in existing analysis systems and future cooperation between invited participants. This is a specific project hypothesis within an established market. The value of automated cooperation across nodes still needs to be demonstrated.
Task and my contribution
My work covered the check implementation, telemetry model, collector integration and validation of the deployment example. The immediate task was a useful single node: check configured web services, retain results locally and deliver interpretable evidence into an existing operating environment.
The design keeps the node's checking responsibility separate from transport, analysis and incident response. That avoids making a new monitoring agent the owner of every operational function, while leaving integration and its failure modes explicit.
Actions: make measurements operationally useful
Define what a check actually establishes
HTTP(S) checks record response status, duration and certificate expiry. Certificates are validated; permitted destinations, redirects and timeouts are bounded. A successful request is evidence about that service from that node; it does not establish that every user journey or every network path works.
Separate local evidence from remote collection
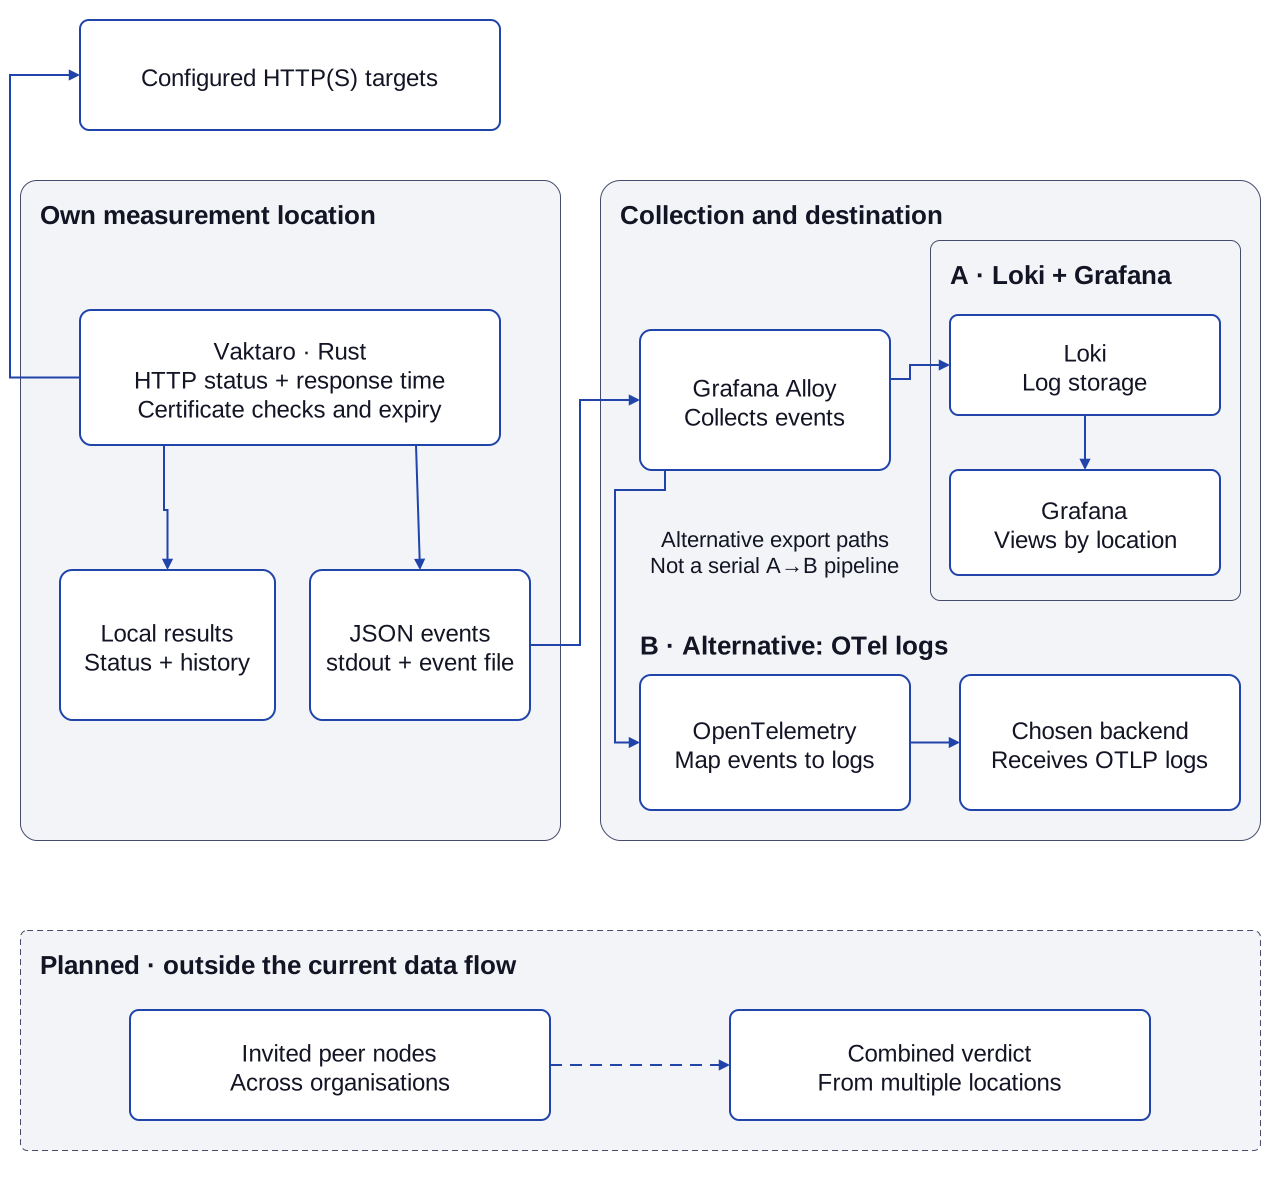
The node retains results and emits structured JSON events. Grafana Alloy handles remote delivery. The deployment example sends logs to Loki for Grafana queries; an alternative maps events to OpenTelemetry log records for a configurable destination. These are alternative collection paths. The node does not need its own dashboard, alert delivery or a native OpenTelemetry exporter to provide useful check results.
Make states and data structure useful for diagnosis
Pending checks, no data and recorded failures must remain distinguishable. The views expose those states instead of treating an absent result as a confirmed outage. Measurement-point identity supports comparison. Target URLs stay in event content or structured metadata rather than creating a separate indexed log stream for every target.
Test the entire result path
The integration setup runs a real node, collector, storage and dashboard queries. It checks delivery, OpenTelemetry fields and every example query, including installation in a different Kubernetes namespace. This catches configuration assumptions that a running container or a screenshot would miss. It tests the data behind the view.
Use capacity evidence to choose the next change
Resource-limited measurements compare scheduled and actual check execution. They identified overhead from the per-target threading model as a scaling constraint, informing a planned concurrency redesign. Raised-limit measurement builds are explicitly separate from the supported node; their figures are not a production-capacity promise.
Results: working implementation and its boundaries
Implemented
The repository provides HTTP(S) checks, local results, a defined event stream, collector configuration and a reproducible Loki/Grafana example. Independent measurement points can be compared in the shared view. OpenTelemetry integration currently carries log records.
Evidence available for review
Source, specifications, integration tests and capacity methodology are public. Together they explain both the behaviour being tested and the limits of each measurement. The implementation and examples can be inspected without relying on a product demonstration alone.
Operating boundary
Vaktaro remains pre-alpha. Peer networking, automated combined assessments and native OpenTelemetry metrics and spans are planned. Existing alerting remains responsible for notification. The bundled evaluation stack has no persistent storage or authentication; deployment needs explicit ownership of retention, access, maintenance and incident response. No reduction in cost or outage duration is established.
Lessons for monitoring decisions
- Model uncertainty before adding automation: Unknown, late and failed are different inputs to an incident decision. Collapsing them creates misleading confidence.
- Keep integration contracts inspectable: Event meaning, node identity, storage fields and queries need to agree. A useful monitoring product includes this operational contract, not just the probe.
- Measure the workload that matters: Timely, complete checks are the service delivered. CPU and memory limits alone cannot establish capacity; simplified tests and modified builds need explicit boundaries.
- Make adoption incremental: Validate the complete data path in a limited environment, keep existing alerts and assign ownership before relying on the new signal.
Project and documentation
Architecture: check nodes and the telemetry contract
The diagram separates active checks, local evidence and delivery. The two documented output paths are alternatives; planned node cooperation sits outside the current data flow.

Text description of the diagram
- The check node sends HTTP(S) requests to configured services. Status, response time and certificate information describe that measurement point’s view.
- Local results and structured JSON events provide the collection interface. Missing data, pending checks and recorded failures remain distinguishable.
- Grafana Alloy reads the event stream. In the example, logs go to Loki and Grafana queries them. Alternatively, events become OpenTelemetry log records exported over OTLP to a selected backend.
- These paths are alternatives, not consecutive stages. There is no Loki-to-OTLP path or native metrics/spans export from the node.
- The integration setup checks result arrival and dashboard queries. The separate future panel describes planned cooperation between invited nodes; existing alerting remains outside the node.
Services and projects
Contact
Send the project, requirements and timeframe by email.